
Find out how our solution helped to develop a repeatable, single-click performance framework for our client.
What We Had
In the past year improving the performance of a middleware product we develop became a core focus for our client. With new versions of the product being released periodically and being deployed by an increasing number of sites, it was paramount that we detect and resolve performance issues before they were released with the product.
Initially our performance tests were performed only when requested, they were slow to configure, kick-off and analyse. These tests typically required several days to prepare and configure a suitable environment and specialised test. The test itself would often run overnight and in some cases failed, resulting in this preparation needing to be repeated. Once the test had successfully run, collating and understanding the results took almost as long again. Our approach, while satisfying our client’s needs, was disruptive to the team, expensive and could not be easily repeated.
Recently when our client made another request to initiate a performance test, we decided to do things differently. Rather than spend days creating a throw-away test, we decided to use that time to develop a repeatable, single-click performance framework.
The New Framework
Leveraging the learnings from our earlier transition to Dev Ops for our development purposes, we were able to rapidly develop a repeatable single-click performance framework.
Our goal was to develop a framework to easily test across versions of the product, to compare performance between versions. We wanted the ability to specify test parameters at the time of initiating a test run and we wanted to automatically collect and collate results into meaningful formats.
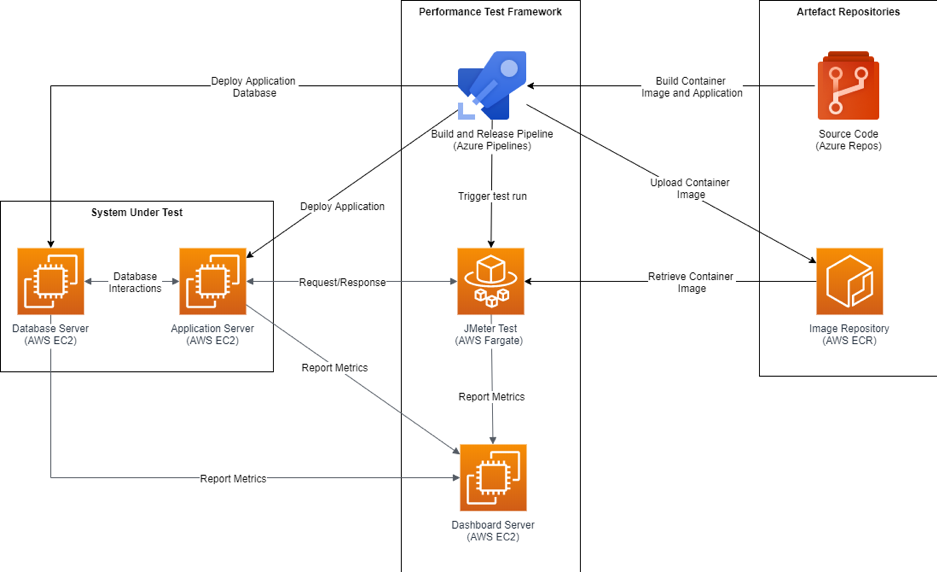
The framework made use of the following key components:
Azure DevOps Repos were used to store our product source code and performance test files (JMeter test, Dockerfile and test assets).
JMeter was used for coordinating the test, sending requests to our product at a configurable rate and reporting throughput and response time metrics to InfluxDB.
Docker was used for containerising the JMeter test.
AWS ECR was used as a repository for storing our Docker images.
AWS EC2 instances were used for hosting our product, as well hosting a reporting server.
Telegraf was installed on the application and database servers to track server utilisation metrics.
Azure DevOps Pipelines was used for building a specified version of our source code, as well as building the JMeter test as a Docker image and pushing to AWS ECR.
Azure DevOps Releases was used for deploying a specified version of our product to an AWS EC2 instance and trigger a container to perform the test run.
AWS ECS (Fargate) was used for deploying a specified version of our product to an AWS EC2 instance and trigger a container to perform the test run.
InfluxDB was used to store metrics from the test run: server statistics from Telegraf and more specific throughput and response time metrics from JMeter.
Grafana used for live dashboarding of test metrics sourced from InfluxDB.
Benefits
The framework has already had some significant benefits:
- Allows us to rapidly trigger a test against any version of our product
- Consistency in test approach
- Has helped us to analyse and identify performance bottlenecks
- Simplified process which can be run by any team member
- Provided us with interactive dashboards for detailed analysis
- Re-usability
Where To From Here
While the framework is serving its purpose for us, there are several ideas on the roadmap for how we could improve it further:
- Automate periodic runs during development
- Trigger performance test when Pull Requests are submitted
- Automate analysis of results
- Dashboarding results over time to detect regressions between versions / commits.

